By Tom Rhoads, Founder & CEO, Spencer Health Solutions
Information about a patient’s quality of life (QoL) is important to clinical researchers because it impacts the likelihood that the patient will remain adherent to their therapy and successfully complete a clinical trial. QoL is also an important endpoint to understanding the full effects of an investigational treatment beyond primary efficacy and safety endpoints.
However, months can go by between clinic visits, making a downward trend in a patient’s quality of life likely to be missed. It also limits the time window for effective intervention.
How can clinical trial sponsors, clinicians, and researchers monitor patients in real-time to ensure safe and successful outcomes for both the patient and the program?
Mobile application technology has revolutionised real-time data collection at the individual level, but mobile apps have a 90-day retention rate of only 25%. By contrast, dedicated in-home technology can have a much higher retention rate, while simultaneously providing specific functionality, such as providing medication reminders, physically dispensing medication, and tracking medication adherence. Such detailed information can be used to make decisions that ultimately result in better patient health outcomes.
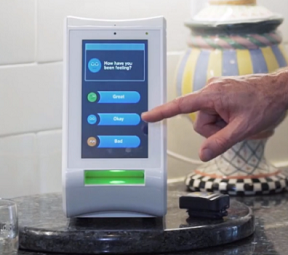
The spencer® smart hub is an in-home patient support platform with all of these capabilities. But can it be used to continuously monitor a patient’s quality of life?
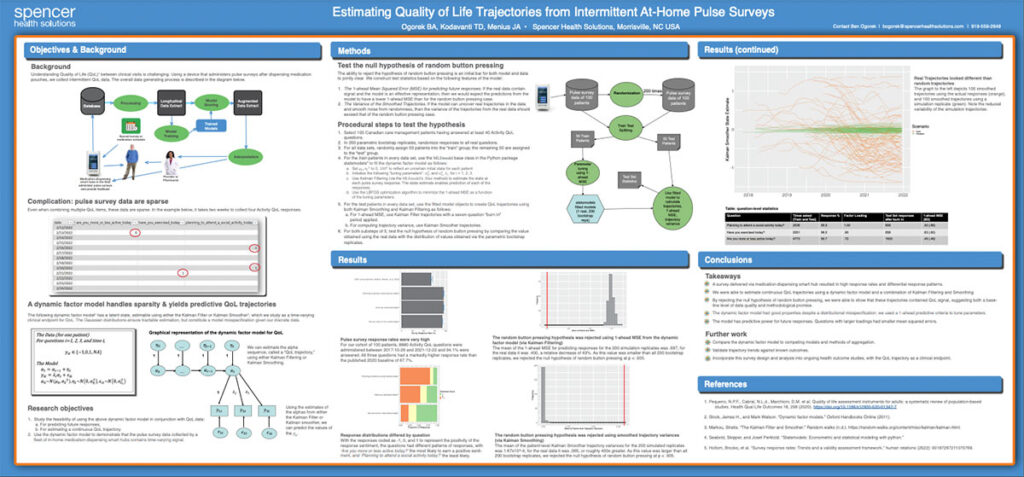
spencer’s single question “pulse surveys” get a response rate of more than 90% when immediately preceded by physical medication dispenses. While a full rotation takes weeks, questions spanning multiple quality of life (QoL) dimensions are never more than a few days away. But is it possible to get a continuous picture from intermittently administered questions? And if you build one, can you trust it?
Putting spencer To the Test
I asked the Spencer Health Solutions Data Team and they said yes and brought their reasoning to the 2022 International Society for Pharmacoeconomics and Outcomes Research (ISPOR) event in Washington, D.C., US in the form of a scientific poster and presentation.
“It wasn’t the most straightforward argument,” admits Chief Data Scientist Ben Ogorek, “but it got us over an initial bar.”
The data team decided to use a data model to aggregate QoL responses across questions, and over time, in a principled way. The result was a patient-specific time trajectory for each patient and a set of QoL dimensions. However, the team needed to make an argument that these trajectories had meaning.
As Ben explained:
“One way to delve into methodological quality is to ask, ‘What would things look like if there was no QoL signal to be found?’ This would be true if, say, patients were choosing survey responses randomly on spencer. If this was indeed the case, and our model’s QoL trajectories came back with fascinating trends, that model should not be trusted! If we were able to view the model’s trajectories when there is a random button pressing next to the trajectories from the real data, they should not look the same.”
As it turns out, “Monte Carlo” simulation techniques helped the team do just that. (Monte Carlo simulations are a tool regularly used by data scientists to help simulate what to expect from data under certain conditions. In this case, it was used to simulate what data would look like if spencer’s patients randomly selected their answers.)
100
Participants
8860
Pulse Questions Answered
94%
Patient Engagement
QoL questions included:
- Are you planning to attend a social activity today?
- Have you exercised today?
- Are you more or less active today?
For each real question that was answered by a real patient, a random response was substituted, and this process was repeated hundreds of times. This allowed my team to peek into a different world and assure themselves that our world is nothing like it.
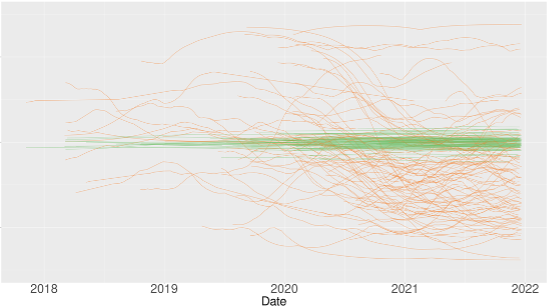
In the image below, the green lines are QoL trajectories from just one of the simulated worlds with random button pressing. You can see they are almost flat and positioned in the center vertically. The orange lines are the real QoL trajectories, which exhibit much higher variability.
Notably, this is an activity-related QoL dimension. A general decrease in activity levels can be seen starting in early 2020, a presumptive link to the real-world COVID-19 lockdowns. Finally, the QoL trajectories computed from real data allowed for substantially better predictions of responses than did the trajectories from the Monte Carlo simulation.
What We Know
“This research doesn’t prove that the QoL trajectory estimating method is perfect, or that the data is always representative of the patient’s true state, but it lets us know we’re on the right track,” says Ogorek. “There are real QoL signals buried in these data collected from spencer that vary over time, and if there weren’t, we’d be looking at the green lines in our own data.”
Still, there is work to be done in further validating spencer’s QoL trajectories.
“If we want to link [the trajectories] to real-world health outcomes, we need to compare the model to competing methods, and we need to continue to refine this method,” says Ogorek.
Click the image below to view the scientific poster presented at the 2022 International Society for Pharmacoeconomics and Outcomes Research (ISPOR) event.